Iron-Carbon Diagram
The iron-carbon diagram was developed to show the microstructural condition of metal as a function of temperature (y axis) and carbon content (x axis). In the partial diagram shown here, we only consider the range of steel with a carbon content of up to a maximum of 2%. Metals with a higher carbon content are classified as cast iron.
Iron
Iron is an element of the periodic table with the symbol Fe (Ferrum) and belongs to the transition metals. In industry or metal processing, the term iron is used to describe cast iron, which is not forgeable. The forgeable steel, is called iron metal.
Carbon
Carbon is also an element in the periodic table and is marked with the symbol C (Carbon). We find the pure form in nature as diamonds or as carbon after a forest fire for example. The bounded one can be found as carbon dioxide, oil or natural gas. Carbon can be found in many organic and inorganic compounds. Without Carbon, life on earth is impossible. About 18% of the human body consists of carbon.
Crystal lattice
As already mentioned cast iron cannot be forged, it is absolutely necessary to make the material forgeable so that further processing can take place. This is done by refining. The produced steel can now be forged and is therefore easier for further processing.
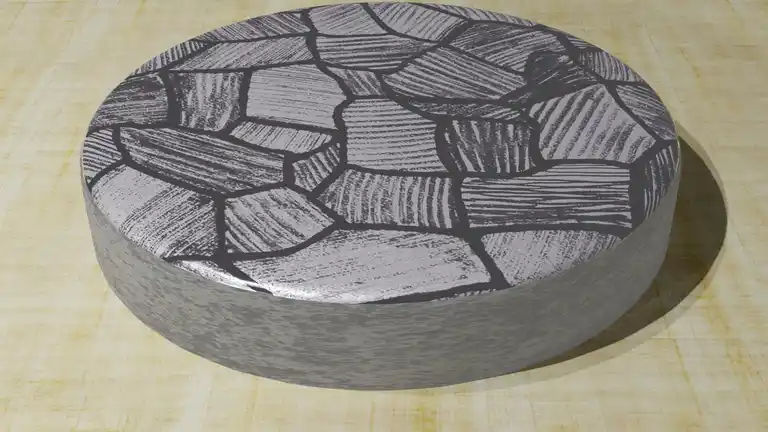
When the metal is molten, meaning in a liquid state, there are no lattice-like structures. The atoms can move freely in all directions. In order to achieve the desired crystal structures, it is necessary for the metal to cool down slowly and completely at room temperature. Thermal treatments in between have a positive effect on the formation of the crystal structures. Iron forms a cubic space lattice. The iron atoms are located at the corners of this lattice.
In low concentrations, carbon does not form a solid chemical compound with iron, but is deposited in the grid gaps of the iron crystal grid. The amount of carbon that can be dissolved in iron depends on the modification of the iron, because the different crystal lattice forms of iron (e.g. cubic space-centered and cubic face-centered) have different sized interstitial spaces.
A subordinate role is played by the Delta Mixed Crystal, which has body-centered atoms but is only of importance in high-alloy steels. These crystals form in the temperature range from 1,536°C (melting point of pure iron) to 1,392°C.
Alpha Mixed Crystal
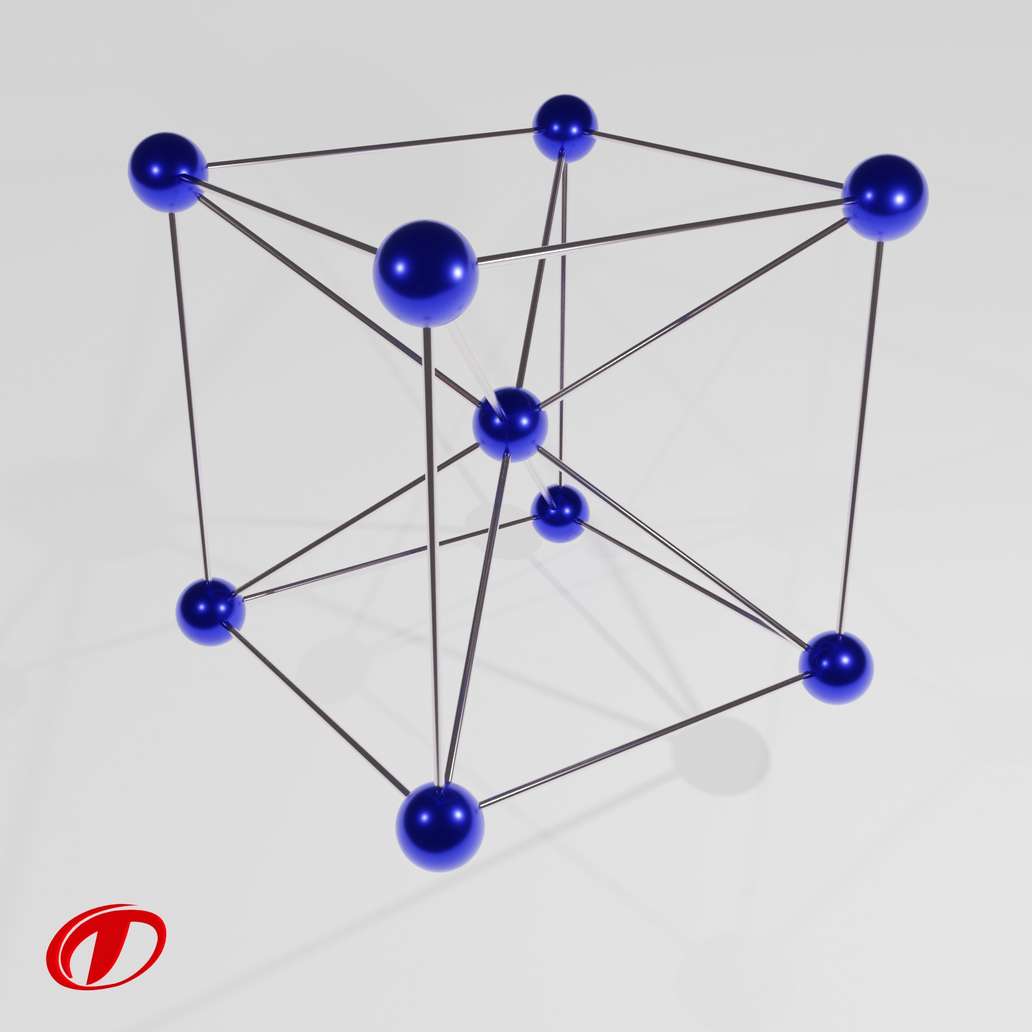
The figure shows the so-called Alpha Mixed Crystal, in which an atom is located in the center of the cube. This is described as a body-centered cubic lattice. These structures form in pure iron up to a temperature of 911 °C.
Gamma Mixed Crystal
The figure shows a Gamma Mixed Crystal. Here the iron atoms are face-centered, i that means they are arranged in the middle of each cube face. These crystals form at temperatures of 1,392°C to 911°C in pure iron.

As already mentioned, the above described crystal lattices have different solubility for carbon depending on the temperature. The carbon is deposited in the interstitial spaces of the crystal lattice, whereby the face-centered cubic lattice, also called austenite, has a solubility at most a hundred times higher than the Alpha Mixed Crystal, ferrite.
If steel is cooled extremely slowly, very different microstructure constellations can occur depending on the temperature and carbon content. This is illustrated in the iron-carbon diagram.
The Iron-Carbon Diagram
Cast iron is not interesting for our considerations. On the vertical axis of the iron-carbon diagram we find the temperature in °C. The metals are shown here from solid to liquefied state. Pure iron begins to melt at 1,147°C. The melting point is 1,536°C. On the horizontal axis we find the percentage of carbon in the metal or structure.
The drawn lines mark the transformation of the metal. Between these transformation lines are sections in which the metal is in a certain state. For example, the conversion from solid to liquid state is shown. But also the reorganization of the atoms can be read. The iron-carbon diagram shows the sections in which the metal only has a certain condition. These are melt, Ferrite or Austenite. Other areas are characterised by combinations of properties. These are, for example, melt and Austenite, Austenite and Ferrite, Ferrite and Perlite.
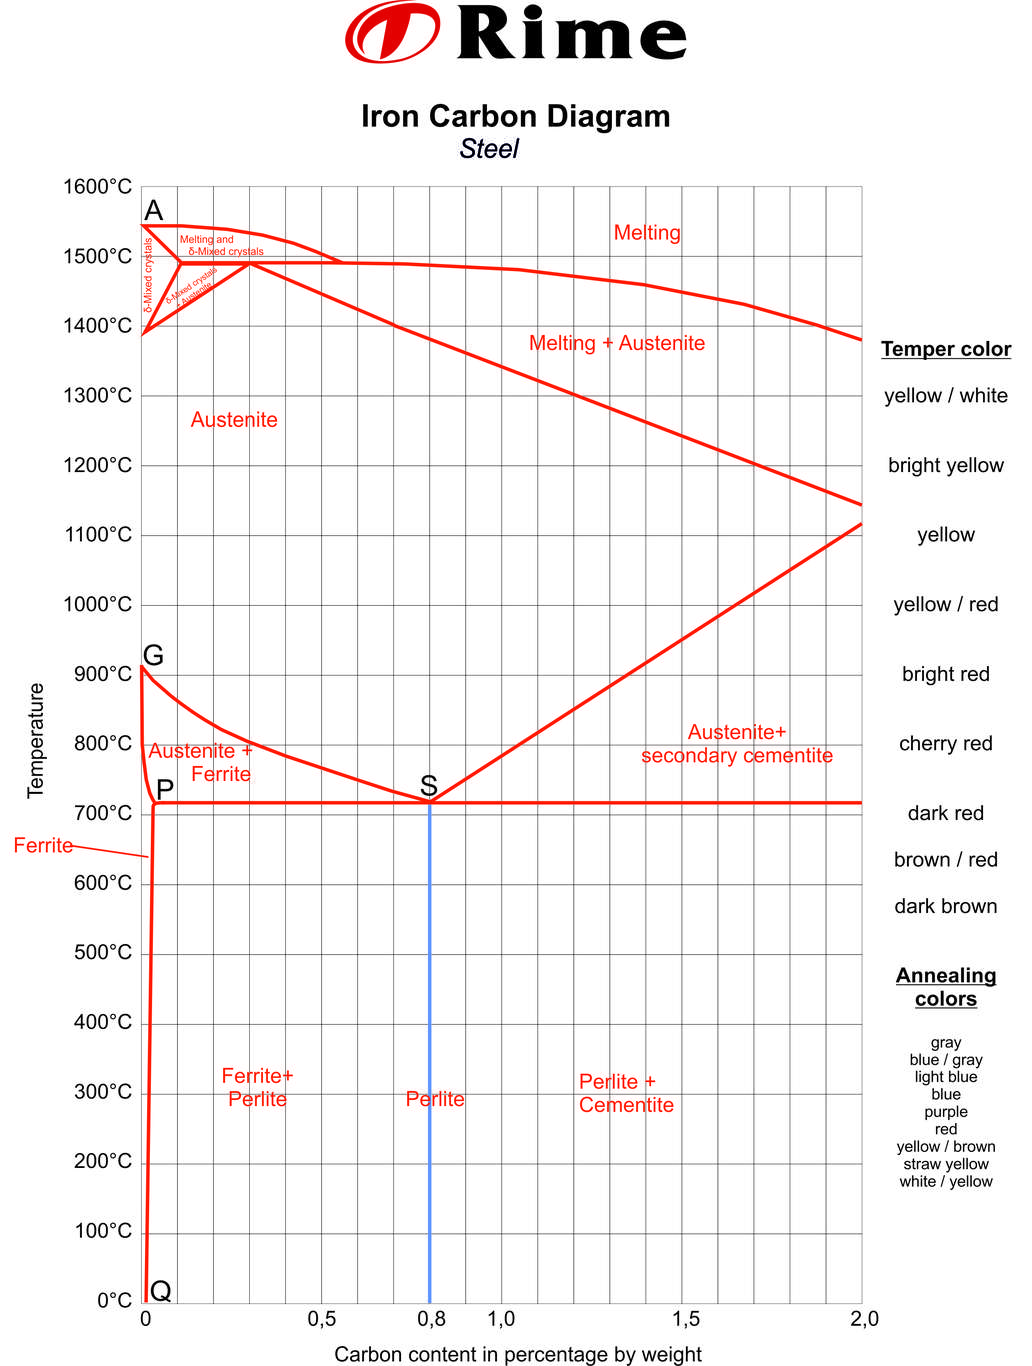
The marking of the intersection points with capital letters on the conversion lines is meant for better understanding. These indicate the transition to another state or condition.
The iron-carbon diagram assumes a constant cooling of the metals. If the metal is slowly cooled down, coarse grains are formed. If the metal is cooled down quickly, fine-grained metal is the result. The type of metal grain determines the strength properties. Coarse grain has a lower strength, but can be made finer-grained and therefore stronger by heat treatment or forming. Fine-grained metal already has a high strength level.
We thank the Bonn-Rhine-Sieg University of Applied Sciences for its great support in producing this article!
See also
Brinell hardness test
Performing the hardness test by means of a ball pressure test according to the Swedish engineer Johann August Brinell.
Read moreCoil
Plate metal that is rolled-up to coils is easier to transport and requires less space in the warehouse
Read moreCorrosion
Corrosion is a natural process and damages most metals. What types of corrosion are there?
Read more